Measures of Central Tendency
Measures of central tendency
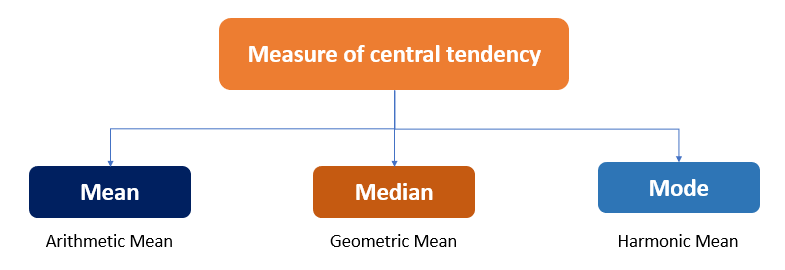
Measures of central tendency are statistical tools used to identify the central point or typical value of a dataset.
Type of Measures of Central tendency
Practical use cases of Central Tendency
- EDA.
- Handling Missing Values.
- Feature Engineering.
- Normalization and Standardization.
- Data Distribution Analysis.
Mean (Arithmetic mean)
definition of mean
The sum of all values divided by the number of values.
Formula of mean
Example of mean
- For the dataset [5, 10, 15], the mean is
Advantage of mean
- Provides a single value that summarizes the entire dataset.
- Useful when all values in the dataset are equally important.
Disadvantage of mean
- Sensitive to outliers: If the dataset contains very large or very small values (outliers), the mean can be skewed, making it an unreliable measure of central tendency for such data.
Numpy in Mean
- How to find mean in numpy
import numpy as np

array = np.array([1,2,3,4])

print('mean = ', np.mean(array)) # output 2.5

# other way to find mean

print('mean = ', array.mean()) # output 2.5
Pandas in Mean
- How to find mean in pandas
import pandas as pd

df = pd.DataFrame({'A': [1, 2, 3], 'B': [4, 5, 6]})

# Mean of all numeric columns
df.mean()
Median
definition of Median
The middle value in a dataset when the values are arranged in ascending or descending order.
Formula of Median
Odd number of data points
Even number of data points
Example of Median
- Let's say we have the following set of numbers: 2, 5, 8, 11, 15.
To find the mean:
Advantage of Median
- Resistant to outliers.
- Works well for skewed distributions.
- Applicable for ordinal data.
- Clear measure of central location.
- Simple to calculate.
Disadvantage of Median
- Ignores data distribution.
- Less informative for symmetric distributions.
- Cannot be used for further mathematical operations.
- Sensitive to sampling.
- Less stable for grouped data.
Numpy in Median
- How to find Median in numpy
arr = np.array([1,2,3,4,20])

print('median = ',np.median(arr)) #output 3
Pandas in Median
- How to find median in pandas
import pandas as pd

df = pd.DataFrame({'A': [1, 2, 3], 'B': [4, 5, 6]})

# median of all numeric columns
df.median()
Mode
definition of Mode
The mode is the value that appears most frequently in a dataset.
Formula of Mode
-
sort the give Value.
-
find the most frequently number and this number is mode.
Example of Mode
-
In the dataset 4, the mode is 2 because it appears more times than any other number.
Advantage of Mode
- Simple to understand.
- Useful for categorical data.
- Not affected by outliers.
- Applicable to non-numerical data.
- Can indicate multiple modes (multimodal).
- Does not require full dataset knowledge.
Disadvantage of Mode
- Not always unique or well-defined.
- Less stable for small datasets.
- May not represent central tendency well.
- Ignores much of the data.
- Difficult to use with continuous data.
- Not suitable for advanced analysis.
Numpy in Mode
- How to find meaModen in numpy
from scipy import stats
import numpy as np
arr = np.array([1,2,3,4,3,20])

print('Mode = ',stats.mode(arr)) #output 3
Pandas in Mode
- How to find Mode in pandas
import pandas as pd

series = pd.Series([1, 2, 2, 3, 3, 3, 4])
mode_value = series.mode()
print(mode_value)  # Output: 3